martes, 18 de diciembre de 2012

Main migration waves


The main waves of migration were migrations of the world to America.

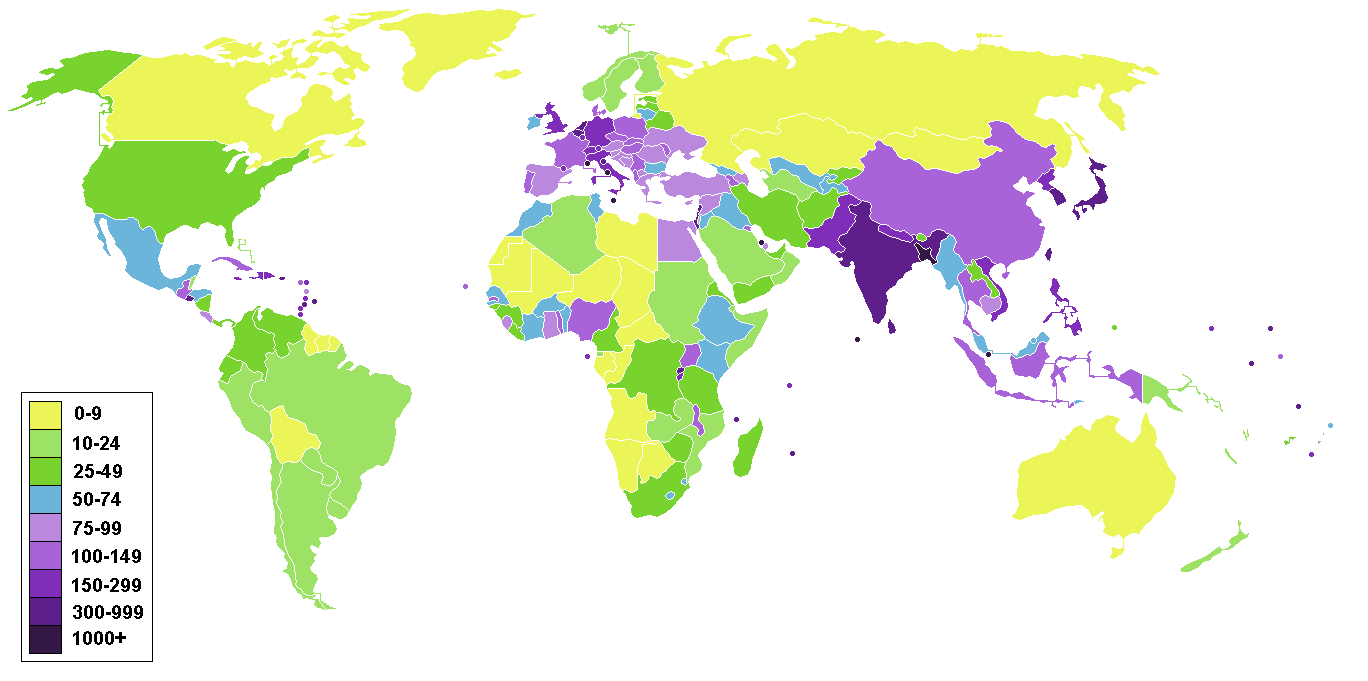
People of central and northern Europe emigrated to South America, and then, they went to Canada and to the EEUU but some people stayed here (in Argentina, Brazil...). People from Spain emigrated to America specially during and after the war in our country (you can see it on the map).


lunes, 17 de diciembre de 2012

Map of the natural increase of the world population

These maps shows the evolution of the growth of the world's population between the years 1950-2009 and 1950-2010:


Natural population change refers to increase and dicrease in population produced by biological factors (like births and deaths):
Natality: number of births that take place on a population over a year.
Mortality: number of deaths that take place in a population over a year.
Natural increase: number of births minus the number of deaths.
Real growth = Natality-Mortality+Immigration-Emigration


Population density


Population density is the relation between the population of a place and the size of the area it occupies. It is calculated by dividing the number of inhabitants by the total land area and is expressed as inhabitants per square kilometre (inhabitats/km2).


Model of Population Cycle


Stage 1 - High Fluctuating

Birth Rate and Death rate are both high. Population growth is slow and fluctuating.

Reasons

Birth Rate is high as a result of:

  • Lack of family planning
  • High Infant Mortality Rate: putting babies in the 'bank'
  • Need for workers in agriculture
  • Religious beliefs
  • Children as economic assets

Death Rate is high because of:

  • High levels of disease
  • Famine
  • Lack of clean water and sanitation
  • Lack of health care
  • War
  • Competition for food from predators such as rats
  • Lack of education
Typical of Britain in the 18th century and the Least Economically Developed Countries (LEDC's) today.

Stage 2 - Early Expanding

Birth Rate remains high. Death Rate is falling. Population begins to rise steadily.

Reasons

Death Rate is falling as a result of:

  • Improved health care 
  • Improved Hygiene (Water for drinking boiled)
  • Improved sanitation
  • Improved food production and storage
  • Improved transport for food
  • Decreased Infant Mortality Rates

Typical of Britain in 19th century; Bangladesh; Nigeria


Stage 3 - Late Expanding

Birth Rate starts to fall. Death Rate continues to fall. Population rising.

Reasons:

  • Family planning available
  • Lower Infant Mortality Rate
  • Increased mechanization reduces need for workers
  • Increased standard of living
  • Changing status of women
Typical of Britain in late 19th and early 20th century; China; Brazil

Stage 4 - Low Fluctuating

Birth Rate and Death Rate both low. Population steady.

Typical of USA; Sweden; Japan; Britain

World population distribution


The world is inhabited by more than six thousand million people. Global population growth has not always been at the same pace. It has been estimated that by the end of the 21st century, the world will have about 12 billion inhabitants. The distriibution of global population is not equal. Unequal distribution of population is due to physical factors (geography, weather...) and human factors (job opportunities...).